Report Editor
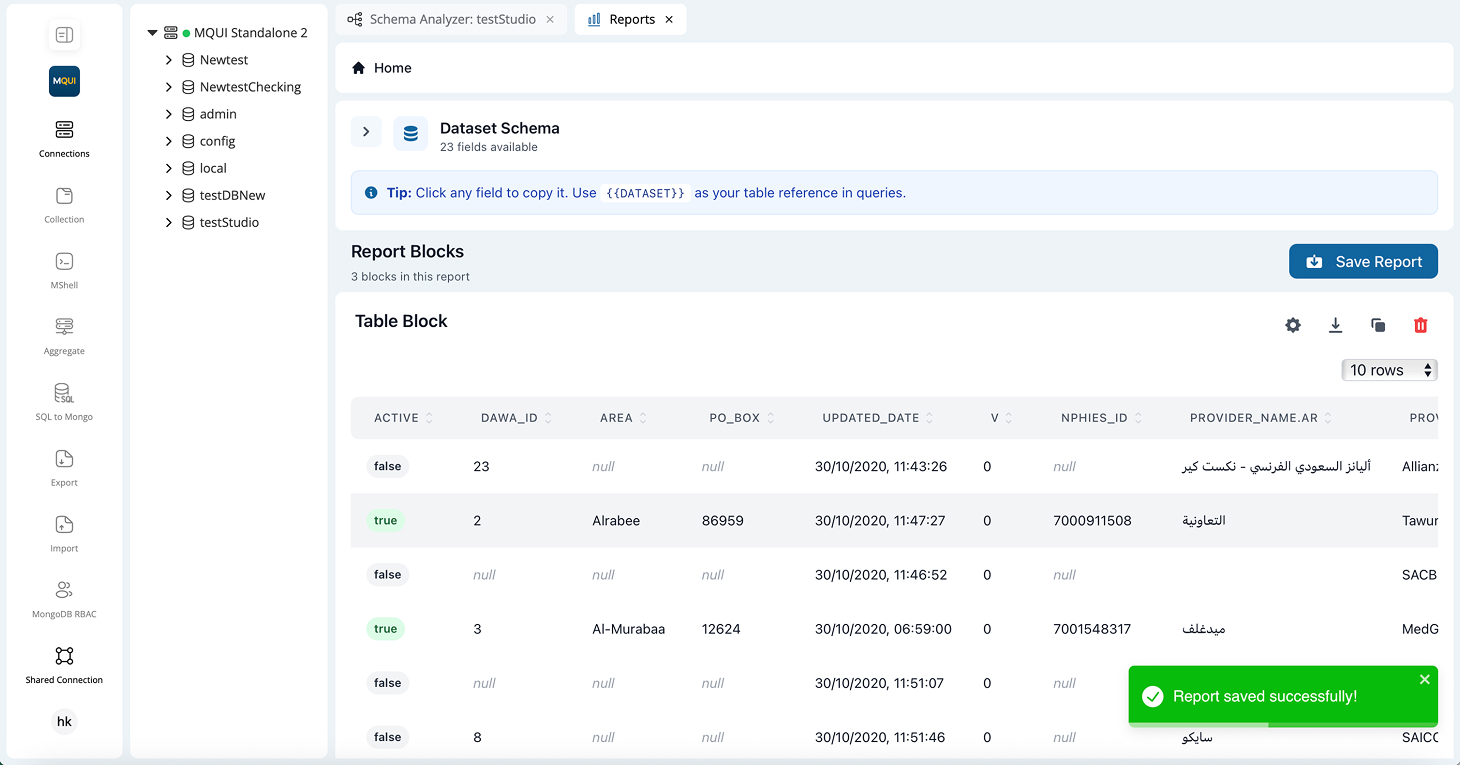
Dataset Section
- Displays collection fields; click any field to copy its name (
{{DATASET}}token tip for queries).
Report Blocks
- A stack of content blocks. Gear ⚙️, download ⬇️, and delete 🗑️ icons appear on hover.
- Add Block button (bottom) launches the Add Content Block modal.
Add Content Block Modal
| Step | Options |
|---|---|
| Layout Type | Single Block, 2 Columns, 3 Columns. |
| Block Type | Table, Bar Chart, Line Chart, Pie Chart, Doughnut Chart, KPI, Text, Image. |
| (future) | Support for mixed-type row/column layouts. |
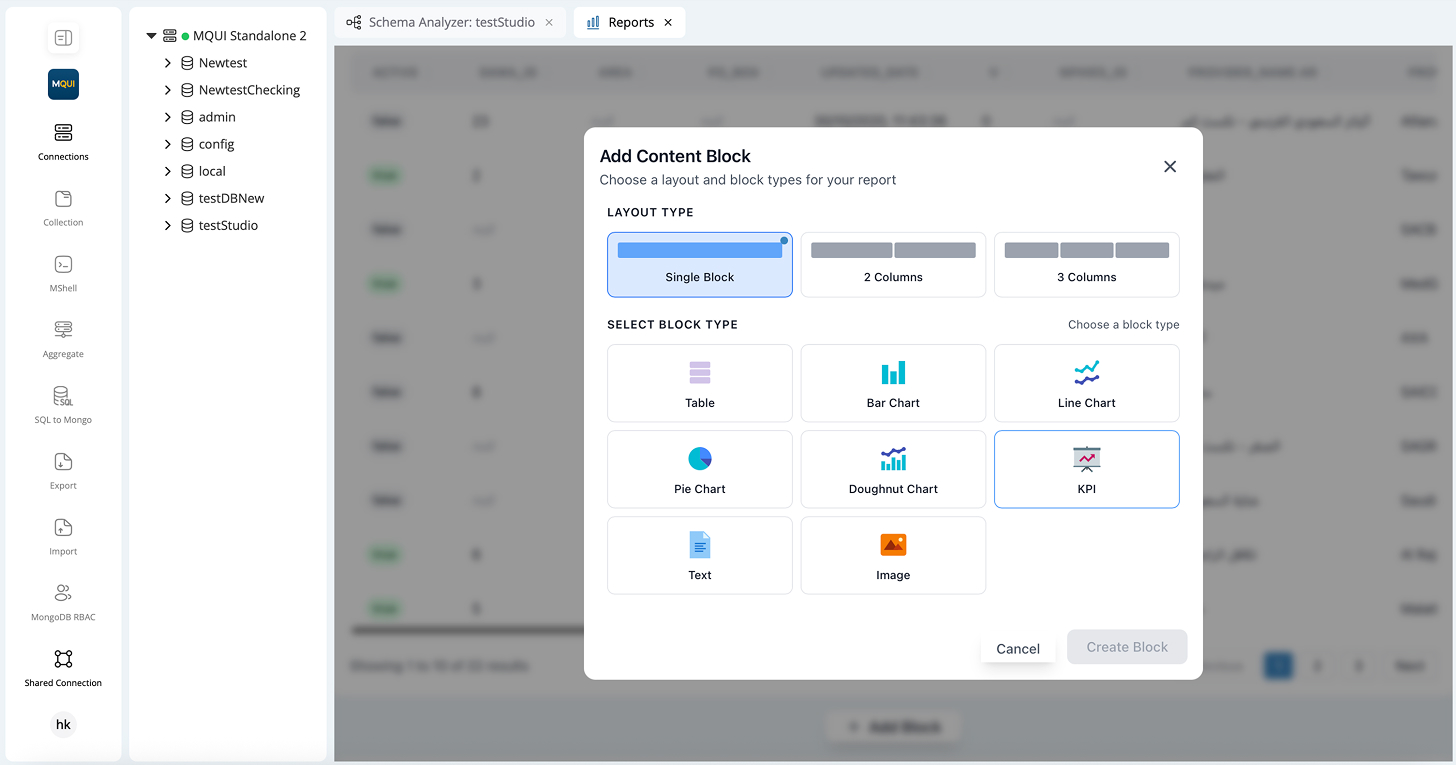
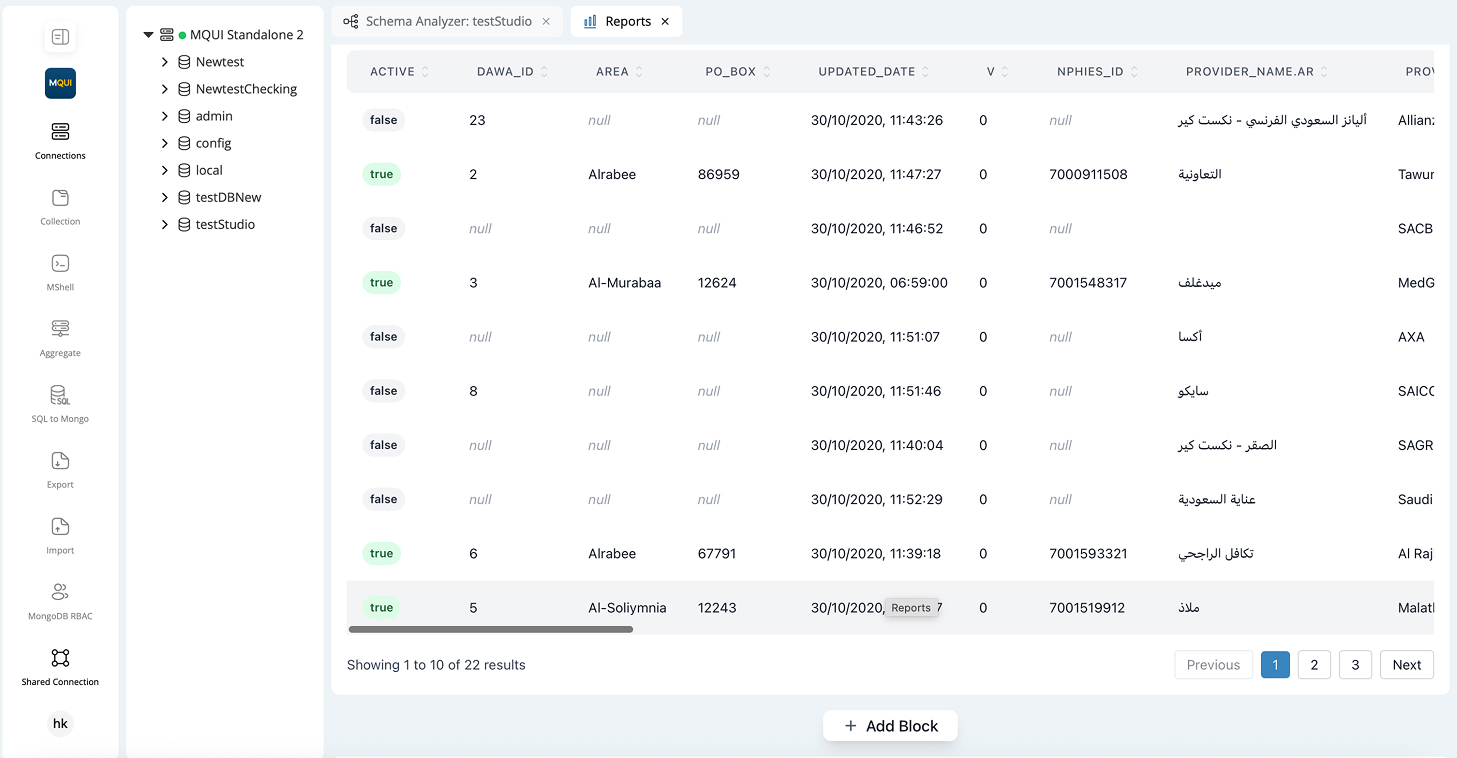
Table Block Example
- Column headers are sortable (▲▼).
- Null values display as
null(grey italics). - Row chips (e.g., true/false) auto-styled for booleans.
- Rows-per-page selector (e.g., 10 rows).
Actions
- Save Report (top-right) – persists layout & blocks.
- Success toast: “Report saved successfully!” confirms write.
Best Practices
- Name conventions – Use
<collection>-<purpose>(e.g.,AccessTokens-WeeklyKPIs). - Dataset sample – For large collections, pre-filter or sample to improve load times.
- Split dashboards – Keep ≤10 blocks per report for performance.
- KPI blocks first – Place headline metrics at the top via drag-and-drop (coming soon).
- Share internally – Prefer Org-member shares over public links for sensitive data.
Keyboard Shortcuts
| Shortcut | Action |
|---|---|
Cmd/Ctrl + S | Save report. |
Del / Backspace | Delete selected block. |
Esc | Exit modals. |
Next Stop: Combine Reports with Aggregate Builder pipelines to feed dynamic datasets into your dashboards.