Reports
MongoQUI’s Reports module transforms raw collection data into shareable dashboards.
Use it to build tables, charts, or KPI tiles directly from your MongoDB collections—no external BI tool required.
Overview
- Access via the Reports icon (📊) in the left sidebar.
- A new tab opens titled “Reports” inside the workspace.
- The landing page, My Reports, lists every report you’ve created or uploaded.
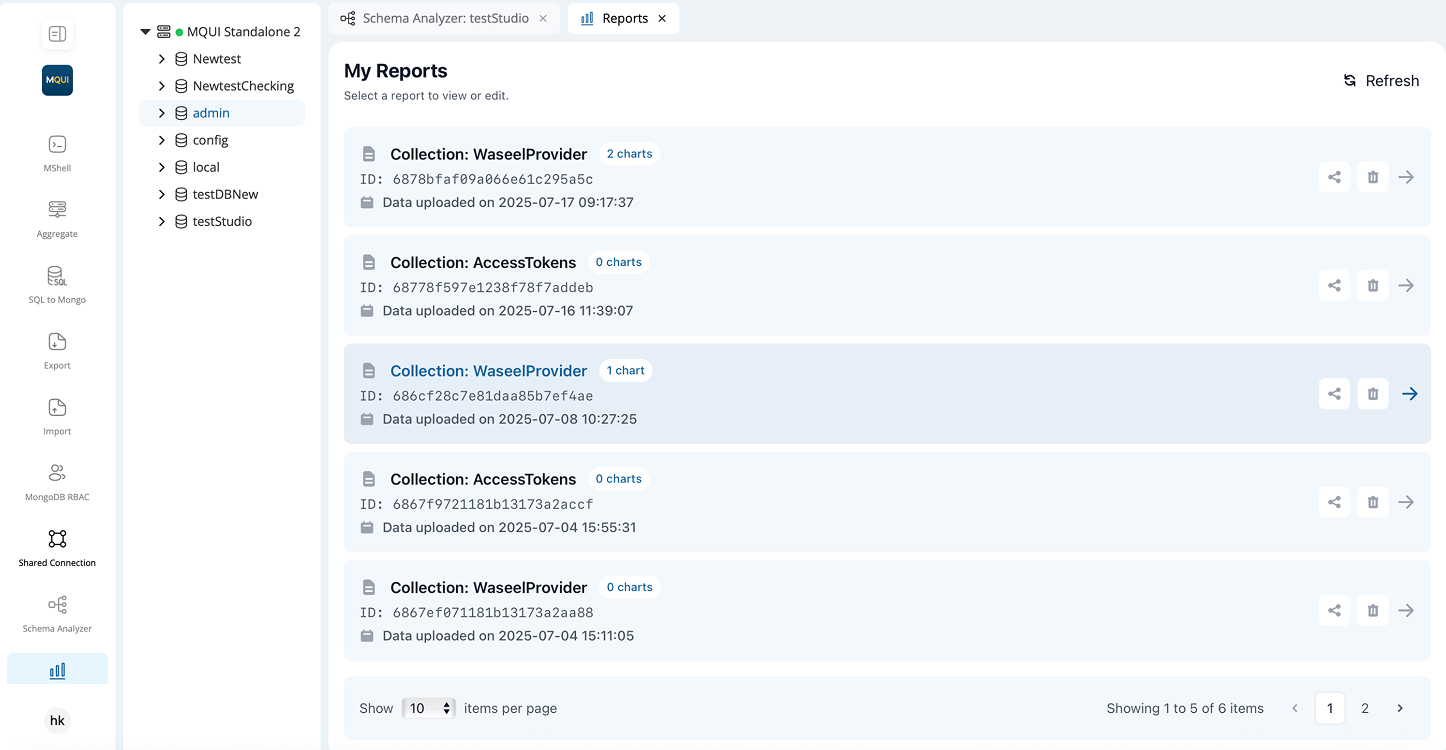
My Reports Page
| UI Element | Description |
|---|---|
| Refresh (🔄) | Re-fetch the list and chart counts. |
| Report Card | Shows collection name, report ID, last data-upload timestamp, and chart count badge. |
| Share (📤) | Opens Share Report dialog. |
| Delete (🗑️) | Permanently removes the report. |
| Open (➡️) | Loads the report editor in the same tab. |
| Pagination | Page selector & “items per page” drop-down at bottom right. |