Pipeline Output Sections
The Pipeline Output area displays the results of your aggregation pipeline.
- Results Pagination:
- Navigate output with pagination (typically up to 200 per page).
- Pipeline Output Tab:
- See live results after running your pipeline.
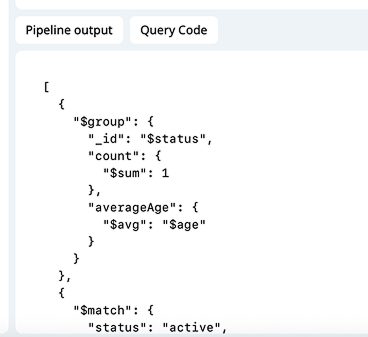
- Query Code Tab:
- View the generated query code for your pipeline.
- Copy this code for use in your projects.
Pipeline Output Tabs:
- Document Count: Displays total number of documents returned by the aggregation output.
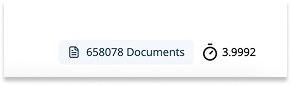
-
Query Execution Time: Shows how long the aggregation pipeline took to execute (in seconds), helping with performance optimization.
-
Refresh Output: Rerun the pipeline to get updated results.
Result Viewer Options
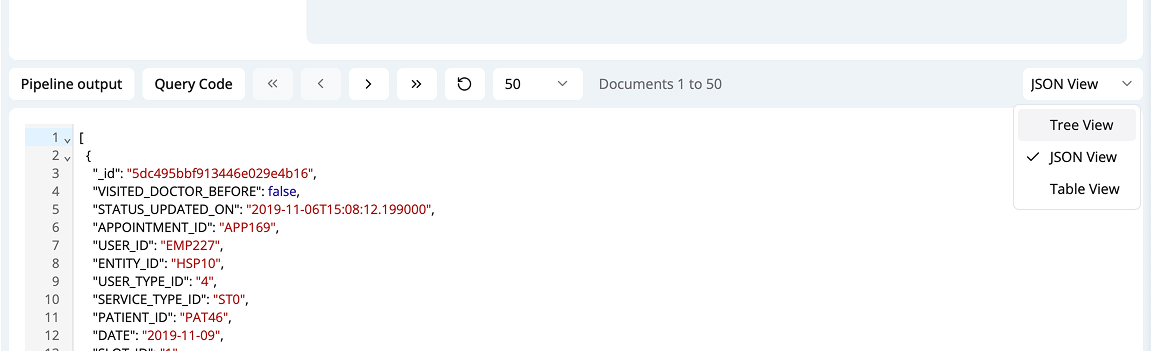
MongoQUI allows you to view aggregation results in several formats:
- Tree View: See documents and fields as an expandable/collapsible tree for easier navigation of nested structures.
- JSON View: View raw JSON output, great for copy-pasting and inspecting the exact results.
- Table View: Tabular format for flat data, making it easy to scan and compare fields.
You can switch between these views via the dropdown in the output section.
Result Viewer Example:
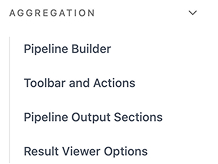
Aggregation Section Navigation
A sidebar or menu (if enabled) allows you to quickly jump to:
- Pipeline Builder
- Toolbar and Actions
- Pipeline Output Sections
- Result Viewer Options
Subsection Nav Example:
Tip:
Combine the features above to rapidly prototype, debug, optimize, and reuse MongoDB aggregation pipelines. The mix of visual controls, code export, reporting, and AI gives you both power and convenience.